Lower Cutoffs, Weaker Students? What the BITS Data Actually Show
Are BITSAT cutoffs going down, and if they are, does that mean newer BITS batches are less capable? The first question is measurable, so I measured it: final admission cutoffs for every B.E. branch at Pilani, Goa and Hyderabad, 2012 to 2025 - 542 observations across 54 series, plus a modeled four-year fee line. The result is the explorer below. It is fully interactive: toggle campuses and branches, switch between raw scores, percentages and the fee overlay, zoom into any period.
What fell
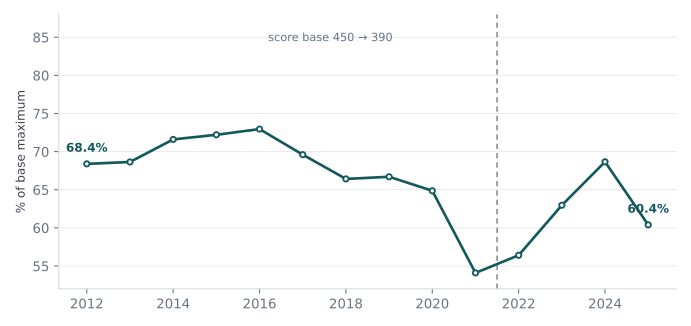
To keep the comparison honest I used the same 19 campus-branch combinations observed in all 14 years, and expressed every cutoff as a percentage of the exam’s base maximum (BITSAT moved from a 450-point base to 390 in 2022, so raw scores are not comparable across that line).
| Fixed group | 2012-14 | 2023-25 | Change |
|---|---|---|---|
| All 19 matched B.E. series | 69.5% | 64.0% | -5.5 pts |
| Pilani, seven matched branches | 73.7% | 65.2% | -8.5 pts |
| Computer Science, three campuses | 74.4% | 76.5% | +2.1 pts |
| Mechanical, three campuses | 69.9% | 60.6% | -9.2 pts |
| Chemical, three campuses | 65.8% | 56.6% | -9.2 pts |
Year by year, the matched index looks like this - note the 2022 break, where the scoring base changed, and the fact that 2025 lands lower than 2022:
The decline is concentrated in core engineering. Pilani Mechanical fell from 73.8% of the base maximum in 2012 to 60.3% in 2025; Pilani Chemical from 70.2% to 53.8%. CS held up at Pilani (-1.2 points over the same span) and rose at Goa and Hyderabad. Three broad branch groups, three campuses averaged:
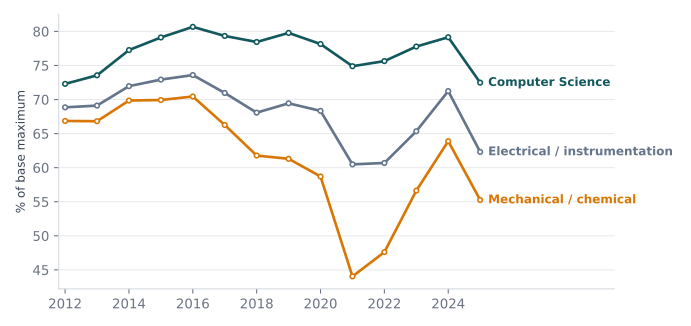
CS is not untouched, though: its recent average sits 2.1 points above the 2012-14 baseline but 3.2 points below its own 2015-17 peak. Which story you get depends on the baseline, so all baseline windows are in the explorer. And recent years are no smooth slide: the matched index went 56.4% in 2022, 63.0% in 2023, 68.7% in 2024, then 60.4% in 2025 - a rebound followed by one sharp common drop, not a steady slide.
A cutoff is not the average student
A closing cutoff is the score of the last admitted student: one order statistic, not the distribution. Take five students scoring 70, 75, 80, 85, 90 - cutoff 70, average 80. A later class at 60, 85, 90, 95, 100 has cutoff 60 and average 86. Another at 60, 65, 70, 75, 80 has cutoff 60 and average 70. The same lower cutoff fits both a stronger and a weaker class:
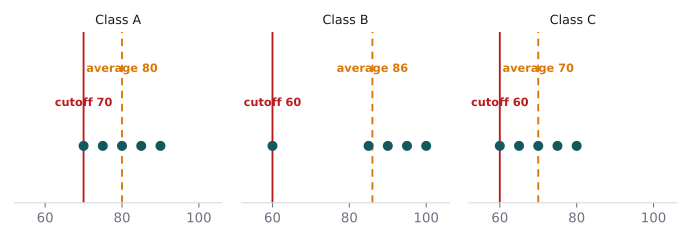
Thresholds also move when seats, applicant mix or acceptance rates move, with no change in applicant capability at all. And the ruler itself changed mid-series: the 2022 paper has a different question mix, more logical reasoning, and a best-of-two-attempts rule. Percentages fix the unit change; they do not equate difficulty across years.
What the model says
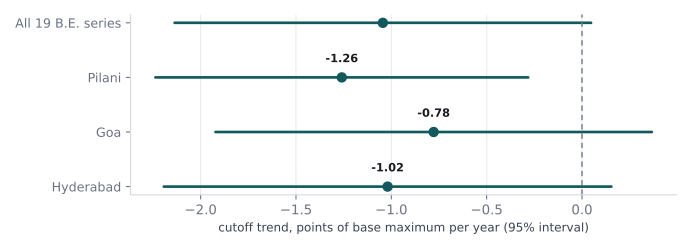
I fitted cutoff percentage against a fixed level per campus-branch, a linear year trend and a 2022 level shift, with uncertainty computed from the 14 annual averages. The pooled trend is -1.04 points per year (95% interval -2.14 to +0.05; p between 0.04 and 0.11 depending on settings), clearest at Pilani (-1.26 per year, p = 0.016):
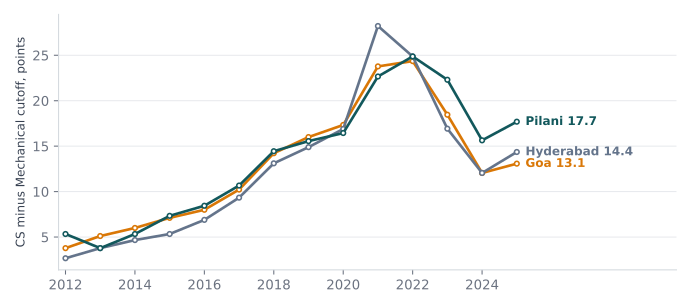
The strongest result is relative: the gap between CS and Mechanical cutoffs at the same campus grew from 3.9 points in 2012 to 15.0 in 2025 - 17.7 at Pilani - about 1.8 points per year (p < 0.001), and it appears in 2012-2020 data alone, before the scale change:
Scores are not noise, either
Entrance tests carry real signal. Frey and Detterman (2004) found a 0.82 correlation between SAT scores and a cognitive-ability measure; Friedman, Sacerdote, Staiger and Tine (2025) found SAT/ACT scores strongly predict first-year grades at Ivy Plus colleges. But none of this is BITSAT data, and no longitudinal study I could find validates BITSAT against later outcomes. That is a research gap, not a verdict in either direction.
Why did thresholds fall?
The usual suspects are fees, seats and shifting preferences. My modeled four-year budget (about ₹33.3 lakh for a 2026 Pilani entrant) correlates -0.684 with the cutoff index - and +0.996 with the calendar year:
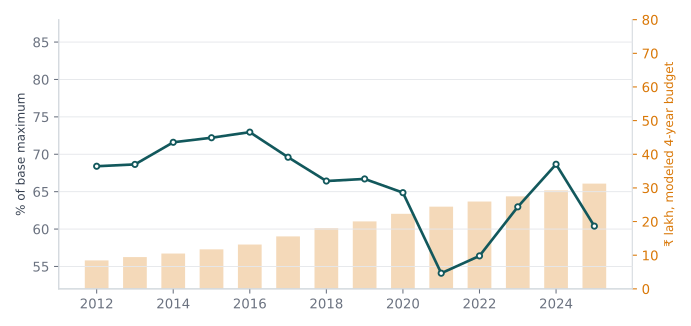
With one fee observation per year, “students were priced out” cannot be separated from “everything else that changed since 2012”. Branch-level seat histories are not public, so the seat-supply story cannot be tested here. Preference shift toward CS fits the widening CS-core gap better than any capability story, but fitting is not proving.
Verdict
Yes, admission thresholds fell: about 5.5 points on the matched basket, 8.5 at Pilani, around 9 for Mechanical and Chemical across campuses. No, this does not show the average incoming student is weaker: the threshold is not the distribution, the exam changed mid-series, recent years are not monotonic, and CS behaves differently from the rest. What would settle it: entrant score distributions on a comparable scale, branch-level seats, offers and acceptance rates, net fees, and a validated BITSAT-to-outcomes link. If that data exists, it lives inside BITS.
Data notes: cutoffs are final post-iteration values as a percentage of the base maximum; 2017-25 from BITS’ official archive, 2012-16 from secondary tables (rechecked for transcription errors, not independently corroborated). Fee line is a modeled gross four-year budget with flagged proxy years, not what students actually paid. “BITS” means the three Indian campuses. All series and code available on request.