Ten Years of IIT Closing Ranks: What Actually Got Easier
Every year the same headline does the rounds: IIT cutoffs are falling, so IITs must be getting easier to get into. The first half is measurably true. The second half does not survive contact with the data. I pulled the official records: final-round closing ranks for every B.Tech program at all 23 IITs, 2016 to 2025, from JoSAA’s own archives (2,658 rows, OPEN category, gender-neutral), plus the JEE Advanced reports from 2012 to 2025 for what happens before the ranks exist. The explorer below has every series.
Pick an IIT group, toggle branches, and switch between raw closing rank and share of the qualified pool. That switch is the whole argument of this post.
The pool grew much faster than the seats
In 2013, 115,971 candidates wrote JEE Advanced and 20,834 qualified. In 2025, 180,422 wrote it and 54,378 qualified. Appeared grew 56%. The qualified pool grew 161%. Meanwhile the number of IIT programs in the OPEN category went from 218 to 302 (up 39%), almost all of the growth at second- and third-generation IITs (their programs went from 46 to 105 and 20 to 39, while the old seven stayed flat at about 125).
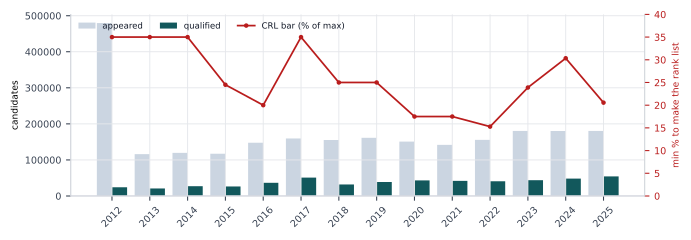
The red line is the other moving part. The bar for entering the rank list was 35% of maximum marks until 2014. It has been as low as 15.28% (2022, or 55 out of 360) and as high as 30.34% (2024, 109 out of 360). In 2018 the initial 35% bar produced only 18,138 qualified candidates against roughly 11,000 IIT seats; the ministry asked for more, the bar was lowered to 25%, and the qualified count became 31,988. The qualifying bar is a policy dial, not a constant, and it has been turned steadily downward since 2017. Every “closing ranks are falling” take that ignores this is measuring the dial, not the competition.
CS at the top did not move
At IIT Bombay, computer science closed at rank 60 in 2016 and rank 66 in 2025. In between, it never left the 59-to-68 band. Delhi: 115 to 126. Madras actually tightened: 173 to 171 in raw terms, and from 0.47% to 0.31% of the qualified pool, meaning it got harder relative to the field. Kanpur drifted from 230 to 271 but improved in pool-relative terms, 0.63% to 0.50%.
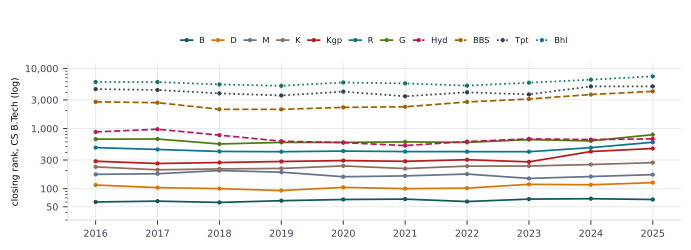
The second-generation IITs show the pattern the headlines are made of: CS at Bhubaneswar slid from 2,783 to 4,162, a 50% drop. But divide by the qualified pool and it is flat: 7.61% to 7.65%. The same candidate percentile gets the same seat; the rank number moved because the pool doubled. At the third-generation IITs, CS did not even slide in raw terms once you adjust: Bhilai went from 5,949 to 7,382 raw, but from 16.3% to 13.6% of the pool. Tirupati, Jammu, Goa, Dharwad: all harder in pool-relative terms than they were in 2016. CS demand grew with the pool. There is no IIT, old or new, where CS is easier to get than it was ten years ago.
The real story is everything that is not CS
Now the part that is true. At the old seven IITs, the median closing rank for mechanical engineering went from 1,394 to 2,771. Civil: 3,703 to 6,161. Chemical: 2,965 to 4,280. At IIT Bombay specifically, mechanical slid from 777 to 1,834 and civil from 2,251 to 4,250. These are pool-relative moves too: Bombay mechanical went from 2.1% to 3.4% of the qualified pool. That is a genuine, large drop in competition for those seats.
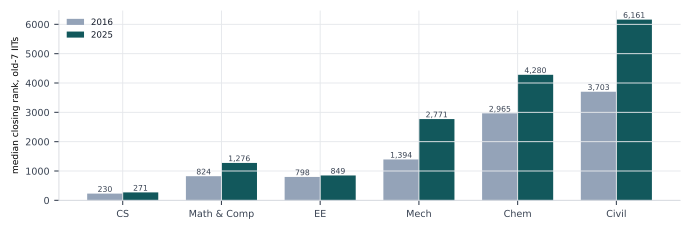
Electrical engineering is the interesting middle. Bombay’s 4-year EE slid from 227 to 433, and its 5-year dual-degree EE from 265 to 841. Delhi’s EE: 403 to 605. In pool-relative terms Delhi EE is dead flat (1.10% to 1.11%), Bombay EE modestly easier (0.62% to 0.80%). Students are not abandoning electrical the way they are abandoning mechanical and civil; they are just not treating it as interchangeable with CS anymore. The premium branch of 2005 is now a solid second choice.
The exam itself got harder, and then the bar got lowered to compensate
Ranks only make sense against the paper that produced them. The JEE Advanced reports publish marks-at-rank tables, and they are wild. A rank of 1,000 took 170 marks in 2022, 219 in 2023, 233 in 2024, and 208 in 2025 (all out of 360). The 2022 topper scored 314; the 2024 topper scored 355. The 2022 paper was brutal, 2024 was generous, and the qualifying bar moved to match: 15.28% in 2022, then 23.89%, 30.34%, and 20.56%.
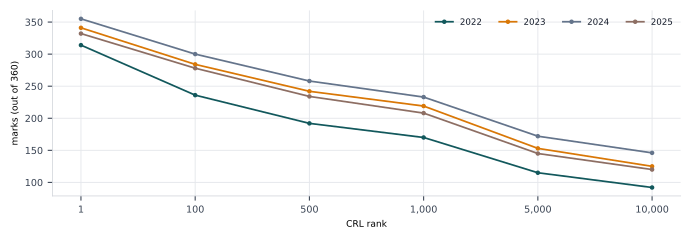
So three things are moving at once: paper difficulty, the qualifying bar, and the pool size. Anyone citing a single year’s cutoff movement as a trend is reading noise.
The floor: what the last IIT seat costs
The cheapest seat in the IIT system has been the same one for a decade: the 5-year architecture B.Arch at IIT (BHU) Varanasi. It closed at 10,422 in 2016, peaked at 22,641 in 2019, and closed at 20,792 in 2025. In pool-relative terms that is 29% of the qualified pool in 2016, 58% in 2019, and 38% in 2025. If you clear JEE Advanced at all, an IIT seat of some description has been reachable for about two in five qualified candidates in recent years.
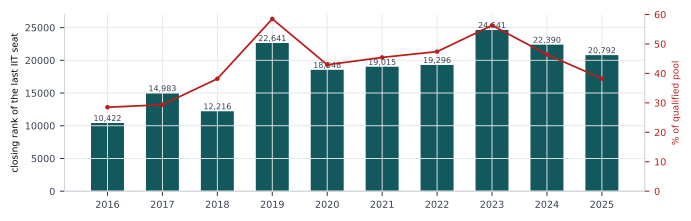
What does a good rank buy? In 2016, 27 program-and-campus combinations closed at or under rank 1,000. In 2025, only 20 did. The middle of the system loosened; the top of the system did not. If the headlines have it backwards anywhere, it is here: getting into an IIT is easier than it was, and getting into the IIT seat people actually compete for is harder.
Data notes: closing ranks are final-round OPEN (gender-neutral) ranks from JoSAA’s official archives (2016-2024 mirrored from the josaa-sql-interface project’s copy of the official CSVs, 2025 from JoSAA’s published round-6 PDF); 2016 was the first JoSAA year, so rank-series start there. 4-year B.Tech and 5-year dual-degree programs are separate series throughout. Qualified, appeared and qualifying-bar figures are from the official JEE Advanced reports (jeeadv.ac.in/reports), except 2015, where the report is not posted and figures come from IIT Bombay’s official press release plus JoSAA’s 2015 business rules. Percent-of-pool uses each year’s qualified count, not the appeared count, because the qualifying bar itself moves. All series available on request.